• The US high yield market has remained steady despite rising tensions and volatility
  • Increasing bifurcation across sectors and issuers means credit investors must be selective
  • With resilient fundamentals and below-average default rates we believe there are attractive investment opportunities across US high yield 

By Jack Stephenson, US Fixed Income Investment Specialist

The last few months have not been straightforward for fixed income markets. As oil prices surged amid the Middle East conflict and inflation expectations rose, markets repriced the potential path of monetary policy.

Even so, the direct impact on US high yield returns has been relatively limited, with a maximum peak-to-trough drawdown year-to-date of -2.2% at the index level, which was recovered in just 11 days.1

This compares favourably to higher quality fixed income and equity market equivalents, as well as historical high yield drawdowns.

There has been little change to the prevailing narrative that high yield provides attractive income with historically tight spreads, which we believe is at least partially justified by structural improvements in quality and security.

Spreads continue to be driven more by rates volatility than the high yield market’s supply and demand dynamics. They widened modestly towards the end of March but peaked at around 350 basis points – still some 100bp lower than 2025’s Liberation Day peak – before tightening back to 270bp in August.2

This swift recovery reinforces the fact that demand for high yield remains strong, dominated by institutional investors and from larger, multi-asset total return funds.

We see this reflected in new issues that are typically oversubscribed with investors not always able to buy as much as they would like, contributing to a technical picture that still feels quite positive – particularly when yields move higher.

Meanwhile, artificial intelligence continues to impact the high yield market both as a driver of new supply and a disruptive force.

Like its effect on the overall economy, AI is exacerbating the unevenness that we see across sectors and issuers in the high yield market, meaning that investors must be selective to manage risks and seek out potential opportunities.

Diverging trends

Recent economic data continues to obfuscate the overall macro landscape somewhat. Solid GDP growth, higher inflation expectations from oil prices, and mixed labour market data makes it hard to pinpoint a singular narrative for the future of monetary policy, all amidst a changed Federal Reserve leadership.  

That said, we are still expecting a strong economic environment driven by the robust capex cycle surrounding the AI and data centre ecosystem, which should be supportive of the high yield market and credit more broadly.

There is certainly fragility to the economic landscape, with significant emphasis on how the consumer fares from here. The higher-income consumer accounts for a significant portion of discretionary spend, buffeted by asset values in housing and the stock market, so benefits from stronger financial markets.

The lower-income leg of this so-called K-shaped economy has recently shown some improving data points, but industries more reliant on discretionary spend from this cohort may continue to feel pressure – particularly if second-round inflation effects from the Middle East conflict emerge.

The credit landscape similarly feels a little disjointed, albeit resilient overall, necessitating a selective approach. The conflict has impacted sectors such as energy – the main beneficiary from higher oil prices – but negatively affected industries that are more sensitive to raw commodity or fuel prices such as airlines, basic chemicals and cruise lines.

Meanwhile, high yield has decompressed across rating cohorts (meaning triple-C rated bonds have underperformed), but the risk of broader credit deterioration remains skewed towards the leveraged loan and private credit markets.

Potential AI winners and losers

Software and data service issuers experienced volatility in the first half of 2026 but started to see more dispersion in the second quarter as the market attempted to determine the potential winners and losers from AI disruption.

Some 95% of leveraged loan software exposure is single-B rated or lower, and many of these issuers have remained at distressed trading levels despite strength in the rest of the market.3

Any shift in the volume of redemption requests from private business development companies (BDCs) and semi-liquid funds could potentially provide a catalyst – either positive or negative – for credit markets over the next couple of quarters.

The flip side of the AI story is that high yield companies linked to semiconductors or construction services for data centres and telecoms continue to witness very strong results.

There has been approximately $48 billion of ‘pure-play’ AI-data centre issuance in the US high yield market dating back to May 2025 (amounting to roughly 3% of the index), which has primarily consisted of issuance from cloud infrastructure providers alongside project finance-style debt used for data centre construction.4

We remain disciplined on this segment in assessing valuation and credit fundamentals before committing capital.

Potential opportunities for selective investors

While pressures persist, the overall environment remains supportive. An average yield for US high yield of around 7% offers potentially attractive income opportunities with the potential to absorb short-term price volatility.

And while a slightly wider spread range towards year-end is possible, fundamentals remain solid overall.

Importantly, the shorter duration of the US high yield market, of around three years, has helped mitigate sensitivity to rising Treasury yields. Back in 2021, US high yield had a duration closer to 4.5 years and a yield closer to 4%, meaning that there was a lot more legwork that needed to be done to reprice the inflationary shock when oil prices spiked in 2022.

But even if the overall market has shortened in duration, we believe the short duration segment itself (which we define as securities with expected take-outs within three years) continues to offer a particularly attractive balance of potential risk/return outcomes, with a high capture of the overall market yield complementing its more defensive characteristics.

An overweight to short duration securities may also be used effectively to ‘anchor’ a full duration portfolio, which can be used as part of a ‘barbell’ strategy to seek out idiosyncratic credits further up the risk spectrum.

The decompression experienced by the US high yield market this year has created a broader opportunity set in this higher yielding segment of the market for selective investors.

Looking ahead, much depends on whether the market’s expectations for default rates shifts higher over the coming months, which we will still think is unjustified for high yield, based on fundamentals.

For the broader leveraged finance market, that is a more challenging question – particularly in relation to private equity sponsored companies who may seek to conduct opportunistic exchanges on investments that are valued significantly below their original purchase price – notably in the software space.

In any case, rigorous credit analysis and active portfolio monitoring will be essential in being able to identify and manage these risks, while seeking out potential opportunities that the current volatility creates.

[1] Source: BNP Paribas Asset Management, ICE BofA US High Yield Index daily returns for 2026 year to date , as of 6 August 2026. Max drawdown occurred on 27 March 2026 and was fully recovered by 14 April, constituting a recovery period of 11 business days.   

[2] Source: ICE BofA US High Yield Index OAS (option-adjusted spread). Data as of 7 August 2026.  

[3] Source: BofA Global Research, LCD, ICE Data Indices, as of 29 January, 2026.  

[4] Source: BNP Paribas AM as of 30 June 2026.
What do you need to know?

Central banks left interest rates on hold last week though inflation concerns exposed divisions among policymakers. The US Federal Reserve maintained rates at 3.5%-3.75%, though three of the 12-member committee opted for a 25-basis-point hike. The Bank of England also kept rates on hold at 3.75%, with three of the nine members voting for a 25bp hike. Additionally, the Bank of Japan held rates steady, at 1%, in an 8-1 vote. Elsewhere, tech-heavy stock markets such as the US Nasdaq and South Korea’s Kospi endured volatility amid concerns over artificial intelligence spending which was offset by strong earnings reports from US tech firms.  

Around the world

The eurozone economy grew more than expected in the second quarter, expanding by 0.4% on a quarterly basis, according to an official flash estimate. Analysts had expected growth of 0.2%. Meanwhile, Q1 GDP growth was revised up to 0% from the earlier reading of a 0.2% contraction. Separate data showed eurozone inflation rose to 2.9% in July, up from 2.8% in June. Elsewhere, the US economy grew less than expected in Q2, at an annualised rate of 1.5% – a slowdown from Q1’s 2.1% and less than the 2% the market had been anticipating.

Figure in focus: 15.7%

S&P 500 companies which have reported Q2 earnings so far have seen an average net profit margin of 15.7% for the period, according to FactSet using data as of 28 July – a record level since it began tracking the metric in 2009. The previous record of 14.8% was only reached in Q1 2026. Some seven sectors have reported an increase in net profit margins on a year-on-year basis, led by communication services – which includes several technology giants. Meanwhile, three sectors have seen net profit margins decrease, with healthcare seeing the biggest decline.

Chart of the week

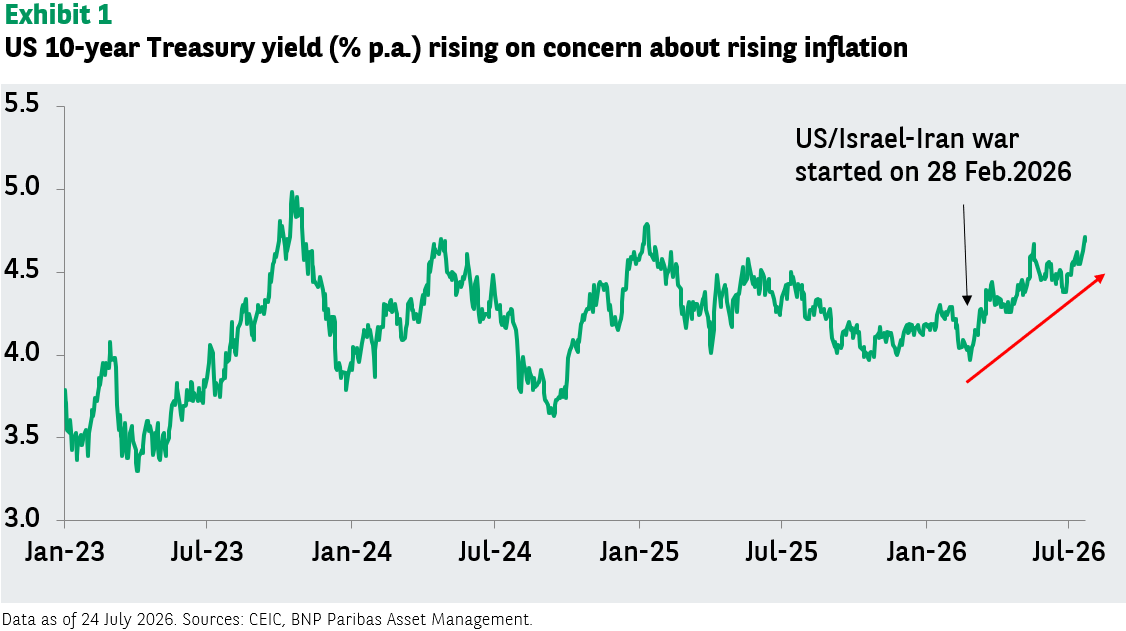
Volatile geopolitical and cyclical conditions suggest inflation, and hence bond yields, may stay higher for longer. Geopolitical disruptions to trade, investment, supply chains, climate change, protectionism, and huge spending on AI infrastructure can all contribute to upside inflation risk. This risk could prompt investors to demand higher bond yields. Investors may also potentially prefer short-duration bonds until the clouds are cleared, due to their typically lower price volatility and quick reinvestment characteristics.

Words of wisdom  

Belt and Road Initiative: Launched in 2013, China’s Belt and Road Initiative is a global investment project, aimed at developing infrastructure and trade routes between China and the rest of the world. During the first half of 2026, the programme saw the highest level of first-half engagement since it began, with $49.8 billion of investment and $76.5 billion of construction contracts, according to research from China’s Green Finance & Development Center. Within that, green energy investment and construction contracts reached a record $20.1 billion in the first half of the year, matching 2025’s total.

What’s coming up?

On Tuesday, the US issues import and export figures for June. Wednesday sees the BoJ publish the minutes of its previous monetary policy meeting, while several final composite Purchasing Managers’ Indices are also issued, including those covering the US, eurozone, UK, Japan and China. On Friday, China reports trade figures, while Canada and the US publish their latest job numbers.

By Daniel Morris, Chief Market Strategist

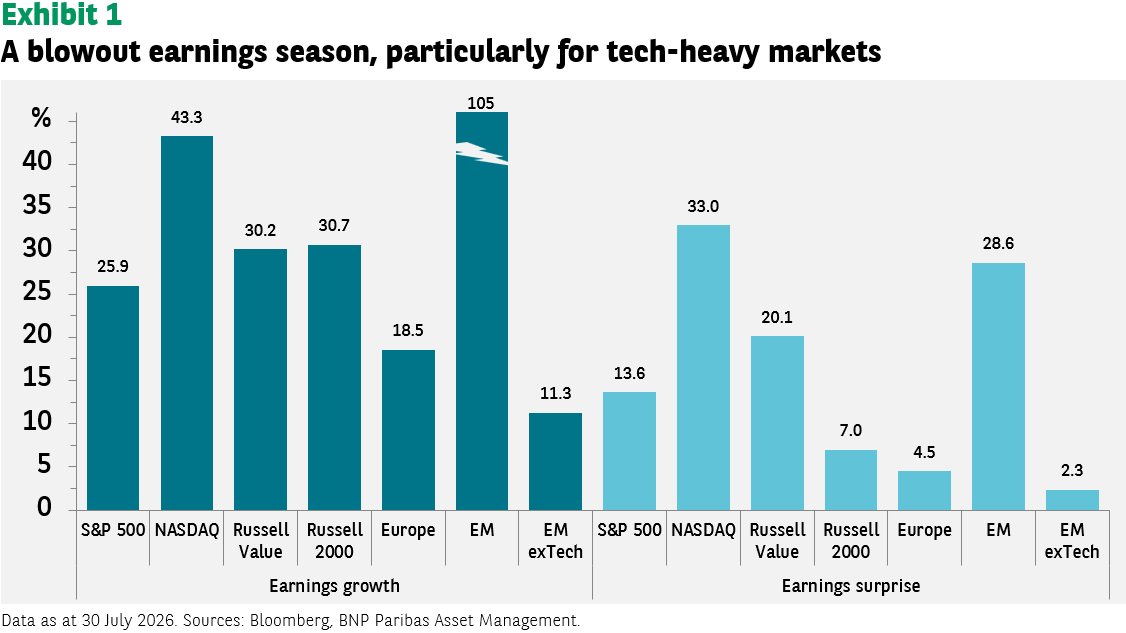
With about half the companies in the S&P 500 having reported second quarter earnings, this season can justifiably be characterised as a ‘blowout’. Earnings for the S&P 500 are up 26% versus the same quarter a year ago. Not surprisingly, tech-oriented indices have seen even bigger gains thanks to massive artificial intelligence-linked capital expenditure. Profits for the Nasdaq 100 index have gone up nearly twice as much as for the S&P 500. The standout, however, is emerging market technology shares, where profits have more than doubled (see Exhibit 1).

Listen to the article

What’s more, these earnings have surpassed expectations (in aggregate). Typically, companies beat consensus estimates by 3%-4% each quarter. This quarter, the surprise percentage has ranged from 5% to over 30%.

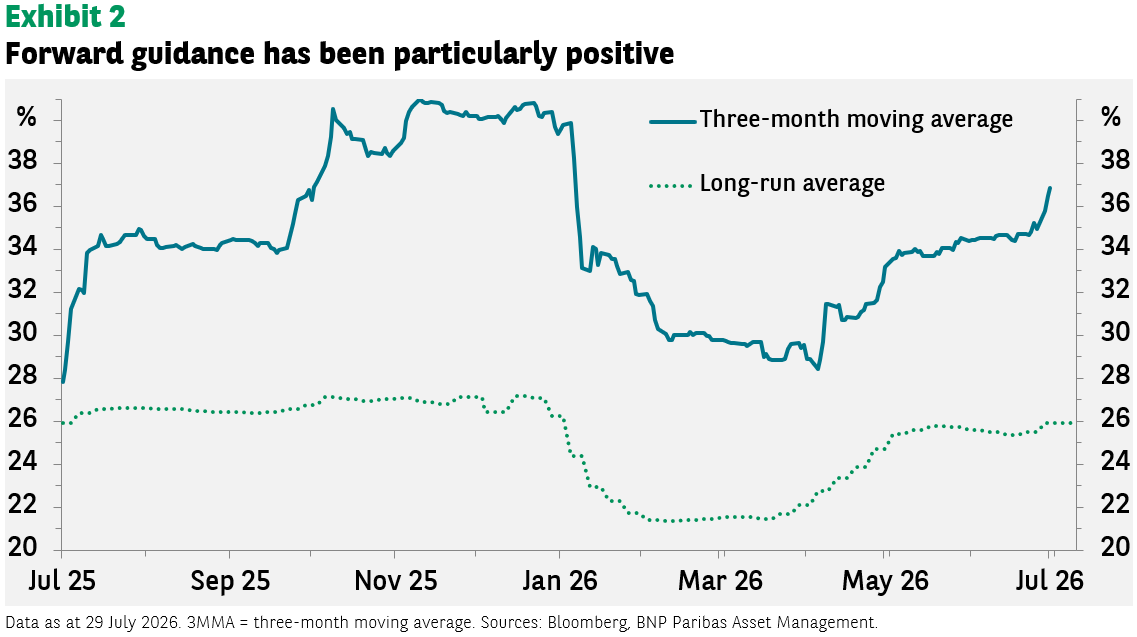
A final indicator of how well the season is going is the proportion of companies giving positive forward guidance, which is high and rising. This figure has been above the long-run average for a year, but it has improved further over the last few weeks (see Exhibit 2).

Market reaction

One might expect, then, that equity markets would be rallying on the news. Instead, many major indices have seen negative returns since the end of June.

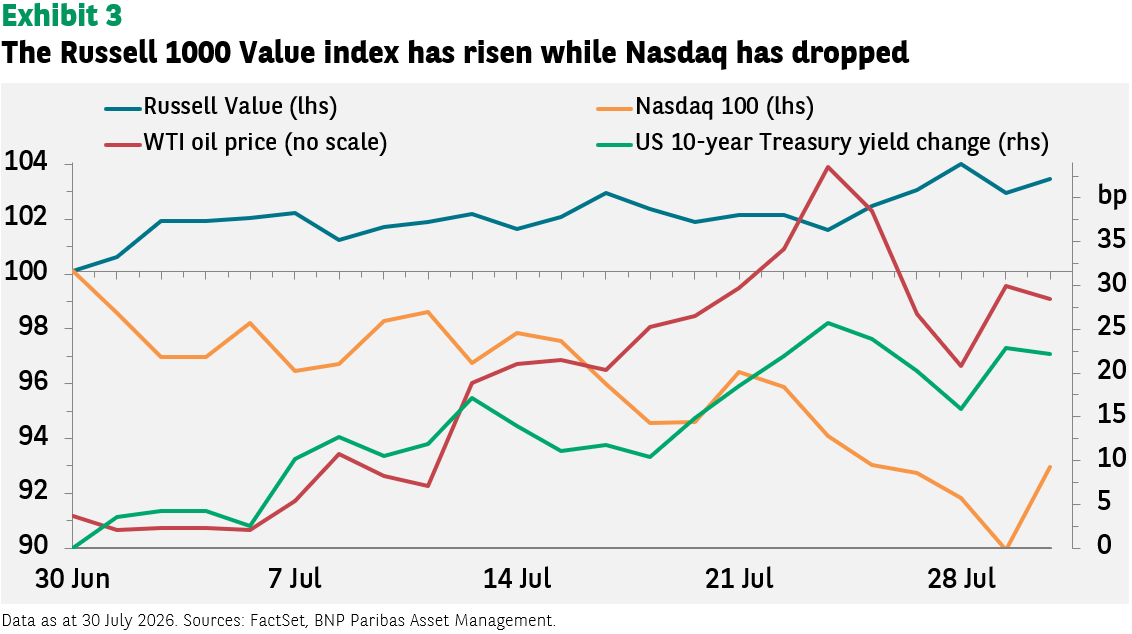
There are several factors behind the declines, some of which may prove transitory. One key negative factor has been the rise in oil prices, currently up around 20% in July, as investors fear the renewed escalation of the conflict in the Middle East. Government bond yields have moved in lockstep with oil, with the impact of inflation on yields outweighing the consequences for growth.

The recent Federal Reserve meeting has added another layer of complexity. The Fed decided not to raise rates, and the press conference has been broadly interpreted as dovish. Observers noted the Fed’s commitment to controlling inflation but are less clear on what measures the central bank intends to use to achieve the objective.

Following the press conference, two-year Treasury yields declined as expectations for a near-term hike in the fed funds rate waned. Longer-term bond yields rose along with oil prices, but they rose more in the US than in Germany, perhaps reflecting worries about the outlook for inflation, and increasing term premia due to limited communications from the Fed.

Meanwhile, emerging market tech stocks have seen a major correction, with Korean hardware and semiconductor stocks falling 47% from their June peak to the trough (as at 30 July 2026), though there has been a sharp rebound since. This drop has spilled over to Taiwanese and US tech indices. Some perspective is necessary, however; the sell-off still leaves Korean tech stocks 79% higher, and Taiwanese stocks 49% higher, than they were at the beginning of the year.

Other markets have proved more resilient. The MSCI Europe index is in positive territory, and the Russell 1000 Value index has moved up over 3% this month, propelled by positive earnings (see Exhibit 3).

The strong earnings results for tech stocks suggest that recent market declines in emerging markets are more a function of stretched positioning and a recalibration of the earnings outlook than a fundamental reassessment of corporate profits. With valuations now far more attractive, and earnings still forecast to rise significantly in the quarters ahead, we believe there is potential for a sustained recovery at some point.

Non-tech markets, meanwhile, have generally been moving steadily higher, supported particularly in the US by AI-spending spillovers and resilient consumer demand. We do not foresee a weakening in those pillars in the near term.

Data sources: Bloomberg, FactSet, BNP Paribas Asset Management as of 30 July 2026 (unless otherwise stated). Past performance should not be seen as a guide to future returns.

Artificial Intelligence (AI) is impacting the media and advertising industries, triggering a pivot away from simply generating billable hours towards the production of higher value-added content. It is also reducing the need for human intervention and discernment. Developments are apparent in the hyper-personalisation of content, raising new issues for regulators.

Matthijs Leendertse, Senior Lecturer for Media Economics at Erasmus University, Rotterdam, talks with Daniel Morris, Chief Market Strategist, about the development of AI and its potential future impact on our societies.

You can also listen and subscribe to Talking Heads on YouTubeSpotify, or wherever you normally get your podcasts.

XXX BNP AM

Read the transcript

Talking Heads with Matthijs Leendertse

Daniel Morris: Hello, and welcome to the BNP Paribas Asset Management Talking Heads podcast. Every week, Talking Heads will bring you in-depth insights and analysis on the topics that really matter to investors. In this episode, we’ll be discussing the impact of AI (artificial intelligence) on the media and advertising industries. I’m Daniel Morris, Chief Market Strategist, and I’m joined today by Matthijs Leendertse, Senior Lecturer for Media Economics at Erasmus University, Rotterdam. Welcome, Matthijs, and thanks for joining me.

Matthijs Leendertse:  Thanks for having me, Daniel.

DM: When we think about the impact of AI, the first things that come to our mind are the impact on employment. Are we all going to lose our jobs and be replaced by AI agents? Interestingly, we seem to have seen the biggest impact so far on the technology industry – big tech companies laying off workers to invest more and more in AI – arguably not so much on other industries, and probably more as individuals or as employees.

We see how we’re using AI, but perhaps don’t perceive the impact it is having across different industries, in particular, advertising and media. Perhaps you can give us some insights on that. Let’s start off with advertising. Historically, creative agencies have captured their highest margins on high-volume execution, scaling assets across channels, rather than strategy itself.  As generative AI automates that production layer, how do agency revenue models need to evolve, and what does this mean for the traditional billable hour?

ML:  When most people think of advertising, they tend to think of the Mad Men era, where you had larger-than-life creatives who created iconic slogans and had big strategic ideas. But if you look at the actual operational engine of traditional agencies, the bread and butter was always the heavy lifting of execution – generating dozens of campaign variations, localising assets and managing high volume junior labour hours.

But what we are seeing now is what you might call a ‘madman in distress’ era, because generative AI hits that execution layer head-on; edtech and generative tools are so accessible that clients themselves are increasingly using AI to handle execution, preliminary ideation, and asset variation in-house. Tasks that used to take an agency weeks of production time can now be done almost instantly on the client side, and that inherently puts massive pressure on traditional billable hour models.

However, it doesn’t mean agencies will disappear. Successful agencies are finding new life as what you could call strategic guides – helping clients navigate and pivot into the AI era, and to adapt on the technology side. You see a lot of agencies, particularly the bigger ones, are aggressively building and buying AI capabilities to guide their clients through this transition.

Take Publicis Group, for instance, the big advertising powerhouse from France. They are acquiring AI content intelligence platforms like Edge AI to give brands predictive, real-time analytics on what content actually works. So instead of just selling hours to execute assets, forward-looking agencies are developing enterprise AI engines and advisory tools to help clients orchestrate their own marketing tech stacks.

And technology is not the only thing; it’s only half of the equation. There’s also a critical human component that software alone cannot replicate, because when algorithms can generate endless creative variations, the real bottleneck actually becomes human judgement, curation, and particularly brand consistency: you can personalise campaigns all you want with AI, but at the same time, a strong brand often relies fundamentally on its shared cultural meaning – the collective story that everyone recognises and makes the brand interesting for consumers.

So, I believe agencies that successfully integrate this deep technological AI capability with human judgments and brand stewardship will be the ones that thrive in this new world.

DM: Let’s move on to media. If we start with digital media and video, I believe we’re seeing two major shifts happening at once: A complete transformation in how content is produced, and a move towards real-time algorithmic delivery. From a sector perspective, how is AI reshaping the economics of video production, and what are the broader retention and monetization implications of these hyper-personalised content loops?

ML:  We are seeing disruption hit both the supply and the demand side of media. If you look at the production side, what we see is that AI is drastically lowering the cost and timeline, especially of video creation in studios and newsrooms. We are seeing what you could call a centaur model emerge, where half man, half machine work on research rendering and automated editing, and it frees creators to focus on the really high-level storytelling.

But it also lowers the barrier to entry so drastically that the sheer volume of video output and other types of output is exploding. To give you a sense of the scale of this, this week alone, Spotify removed 75 million AI-generated songs from its platform. What’s remarkable in media production is that because of AI, the friction between an initial idea and its final realisation is more or less disappearing, and it’s very similar to the concept of vibe coding that we’ve seen in software development, where you actually don’t need to write code, you just express in your own words [your] intent or vibe, and the AI handles the execution.

In media, you no longer always need complex production gear, camera crews, or advanced rendering software to turn a high-level creative vision into a broadcast-quality visual asset, and this collapse in production friction leads straight into the distribution side, where content and distribution effectively merge.

We are moving from an era of the ‘infinite scroll’ – where algorithms select these pre-existing clips for you, like on TikTok and Instagram – to ‘infinite creation’, where the distribution engine itself generates or adapts media in real time, tailor-made just for you.

We already see that viewers are hooked on TikTok curating flat videos for them. But imagine when the content becomes hyper-personalised, where video streams, 3D environments, or narratives dynamically mutate based on real-time micro gesture-tracking and other forms of data.

Behavioural scientists that study games, etc. are already using the term ‘digital heroin’ for personalised content streams because they are so addictive. But can you imagine how addictive media becomes when it isn’t just curated for you but generated in real time, tailor-made just for you?

And this raises profound regulatory questions about public health and well-being, as we are already witnessing the damaging mental health effects of social media and gaming addiction. This could take that to a new level.

But to go back to the economic story, the broader economic paradox strikes at the core funding model of the entire creative and information ecosystem. Primary creators face a direct displacement effect – where cheap automated synthetic output begins to replace the work human creators make – although its success depends on user acceptance, something I’m now researching with my Master students.

But the structural thread goes deeper. If we replace and starve human creators before even understanding the long-term implications, we risk undermining not only the cultural ecosystem that feeds these AI systems, but also the essential democratic function of the media, which depends on a financially viable, independent human press to inform the public and move power to account.

DM:  Well, I have to admit, some of that sounds quite scary, but perhaps I’m simply too old to appreciate the benefits of all of this! Let’s end on regulation, Matthijs. There, the European Union recently enacted the EU AI Act to address some of these systemic risks you’ve mentioned – deepfakes and algorithmic governance. From an institutional perspective, does this framework adequately address the structural risks facing democratic information ecosystems, or are there still underlying economic blind spots?

ML:  I believe the EU AI Act is a groundbreaking piece of regulation, but we also need to be clear what it actually does and where it falls short.

At its core, a risk-based framework for AI is absolutely necessary. It gives us vital tools to combat large-scale disinformation campaigns, which we have seen all over the Western world; to mandate transparency for synthetic media like deepfakes, so everything is labelled and people know it has not been created by humans; and to ban manipulative algorithms that threaten the very integrity of democratic deliberation.

With this EU AI Act, we have to classify systems – for instance, those used to influence elections or alter voter behaviour – as high risks, so that establishes essential safeguards for our democracy.

And big tech, of course, has aggressively lobbied against this, precisely because it shifts liability onto model developers. It imposes heavy compliance burdens on foundational models, and it limits their ability to deploy un-curated algorithms in the European market. From a safety and democratic defence perspective, it sets a global gold standard. However, from a macro and a media economics view, the act has two major omissions, in my view.

First, it regulates safety, but it ignores value distribution. While there is separate EU digital legislation, the AI Act doesn’t solve the underlying economic extraction, where platforms scrape original journalism and content without compensating the creators. Starving the financial engine of independent media remains an unaddressed risk to long-term democratic accountability.

Second, if Europe wants sovereign AI that reflects our public values and democratic standards, regulation alone is not a strategy. You cannot regulate your way to competitiveness and digital sovereignty without economic investment, massive capital deployment and infrastructure incentives. Europe risks total dependency on foreign – particularly US and Chinese – AI stacks.

We do see promising European champions emerge – Mistral in France with its foundation models, Lovable in Sweden pioneering five coding, or German company, Helsing, in AI defence technology. These companies prove that European innovation can compete at a world-class level.

But, to maintain a sovereign democratic digital ecosystem, policymakers must [bring to] bear regulatory guardrails against disinformation with aggressive economic investment, ensuring European AI is built on European values rather than purely imported.

DM:  Thank you, Matthijs. Some of the key points that you mentioned: first, the significant impact that AI has had on the media and advertising industries, causing companies, agencies, to pivot away from just generating billable hours to higher value-added content and the need for human intervention and judgement. You see key developments in the hyper-personalisation of content and mention some of the risks that that may entail.

In response to that, we do have the new EU AI Act, which you noted seems to be a good first attempt to manage some of these risks, but you pointed out it is not sufficient to enable Europe to manage or control the development of AI and its impact on society in the future. Matthijs, thank you very much for joining me.

ML: Thank you very much for having me.

DM:  That’s it for this week’s episode of Talking Heads. If you would like more information about our capabilities in investing in the AI theme, please reach out to your asset management contact or check out Viewpoint, our website for investment insights at Viewpoint.bnpparibas-am.com.

The Talking Heads podcast is available on Spotify and on YouTube, and this is real human-generated content – it is not AI! For YouTube, visit youtube.com/bnppam/playlist and tap or click on Talking Heads.

You’ve been listening to the BNP Paribas Asset Management Talking Heads podcast with me, Daniel Morris, and Matthijs Leendertse, Senior Lecturer for Media Economics at Erasmus University in Rotterdam.

Please do join me next week. Until then, take care.

By Syed Haziq Zikri Syed Danial, Head of Sukuk and Portfolio Manager, Emerging Markets Fixed Income, and Fu Yu, Investment Specialist, Emerging Market Fixed Income

Introduction and asset class overview

The sukuk universe has evolved from a niche financing instrument of Islamic finance into a well-established, institutionally recognised fixed income asset class. Total global outstanding sukuk has now crossed $1.1 trillion, spanning 27 currencies, and has surpassed the size of both the European high-yield market and the Swiss bond market.

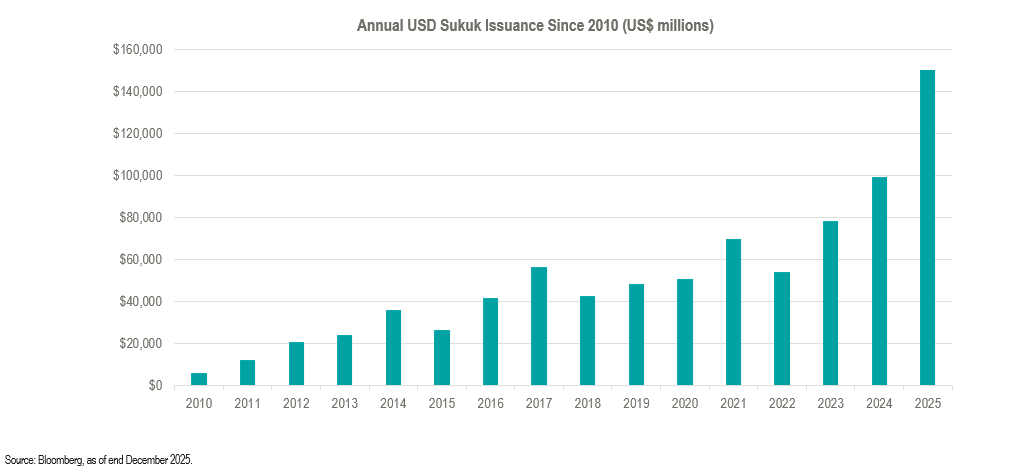
On the US dollar-denominated side, the asset class has also grown from strength to strength over the years (see Exhibit 1a), reaching outstandings of around $428 billion (see Exhibit 1b) as of end 2025.

Exhibit 1a: The USD sukuk universe has seen remarkable growth over the years

Exhibit 1b: Key characteristics of the USD sukuk universe

What began as a financing tool primarily serving sovereigns in the Gulf Cooperation Council (GCC) and Southeast Asia has broadened considerably. Debut issuers such as the Governments of Philippines and Egypt have entered the market alongside recurring participation from South Africa and numerous financial institutions and development banks.

As a constituent of the broader emerging market (EM) hard currency debt universe, global USD sukuk occupies a distinctive niche: It combines the credit profile of investment-grade EM sovereigns and quasi-sovereigns with the structural discipline of Shariah-compliant issuance, which requires valuation to be based on an underlying asset rather than a pure debt obligation.

Geographically, the asset class is anchored by two complementary regions: 

  • The GCC, which draws its fundamental strength from hydrocarbon wealth, sovereign wealth fund buffers, and ambitious economic diversification programmes such as Saudi Vision 2030
  • Southeast Asia, led by Malaysia and Indonesia, where deep Islamic capital market infrastructure underpins regular and diversified issuance. 

By issuer type, sovereigns represent the largest segment of outstanding international sukuk, followed by quasi-sovereign entities and financial institutions, with corporates accounting for the remainder — a composition that skews meaningfully towards high-grade, government-linked credit.

From a credit quality standpoint, the asset class is distinctly investment grade in character. According to Fitch Ratings, approximately 80% of rated sukuk outstandings are investment grade.  Crucially, Fitch noted that approximately 88% of sukuk issuers maintain a Stable Outlook, with no defaults or fallen angels recorded through 2025  — a credit record that compares favourably with many conventional EM bond segments and should provide meaningful reassurance to more risk-sensitive institutional investors.

Superior cumulative performance

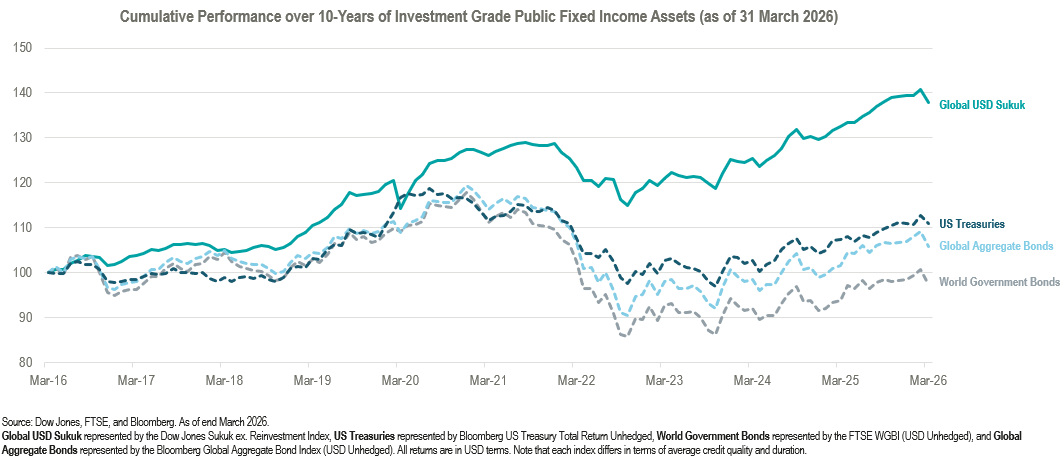
One of the most compelling arguments for allocating to global USD sukuk lies in its historical return record. As measured by the Dow Jones Sukuk Total Return Index (ex-Reinvestment) — the most widely referenced benchmark for the asset class — the index is designed to track the performance of global Islamic fixed income securities, measuring investment in US dollar-denominated, investment-grade sukuk that have been screened for Shariah compliance.

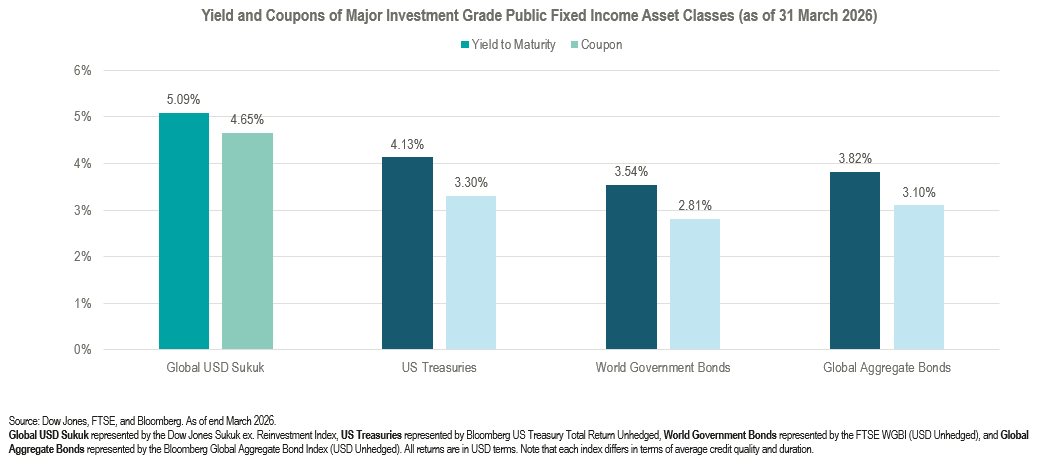
Over the past decade, this index has delivered cumulative total returns that have materially exceeded those of conventional developed market fixed income benchmarks, including US Treasuries, World Government Bonds, and the Bloomberg Global Aggregate (see Exhibit 2a). A critical and consistent factor driving the superior performance is income (yield/coupon), which has also been superior to the aforementioned investment grade peers (see Exhibit 2b).

Exhibit 2a: Compelling returns of USD Sukuk vs. investment-grade peers over time

Exhibit 2b: USD Sukuk can offer higher yield and coupons than its investment-grade peers

While US Treasuries were facing sustained headwinds from a prolonged rate tightening cycle — particularly the historic repricing of 2022 and 2023 — and World Government Bond indices were similarly weighed down by negative-yielding developed market debt during much of the 2010s, global USD sukuk benefited from a combination of a structurally higher carry versus US duration benchmarks, and a predominant issuer base with limited exposure to the fiscal vulnerabilities that plagued segments of the broader EM universe.

The spread premium earned by sukuk investors relative to equivalent-duration sovereign benchmarks, combined with the relatively shorter average duration profile of the index versus the Global Aggregate, allowed the asset class to generate a superior income return stream across the cycle.

This performance differential compounded meaningfully over a 10-year horizon, underscoring why global USD sukuk has increasingly attracted attention from fixed income allocators seeking alternatives to low-yielding developed market bonds without assuming the full volatility spectrum of conventional EM debt.

Risk-adjusted performance and Sharpe ratio

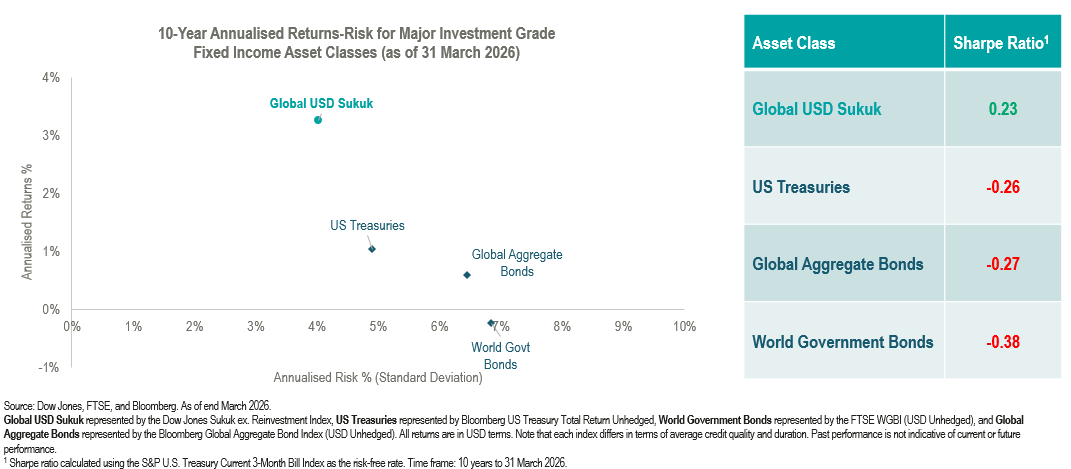
Beyond headline returns, what distinguishes global USD sukuk from a portfolio construction perspective is its risk-adjusted performance profile. The Dow Jones Sukuk Total Return Index (ex-Reinvestment) has consistently delivered a superior Sharpe ratio relative to US Treasuries, World Government Bonds, and the Global Aggregate over the past decade (see Exhibit 3), meaning that investors have been rewarded with more return per unit of risk assumed.

Exhibit 3: USD Sukuk exhibits superior risk-adjusted returns vs. its investment grade peers

This superior efficiency stems from several structural characteristics of the asset class. First, the investment-grade, sovereign and quasi-sovereign credit composition constrains default-driven drawdowns — a material advantage over broader EM debt benchmarks that carry higher-yield, more volatile exposures.

Second, the buy-and-hold behaviour of sukuk investors in the GCC — particularly large Islamic banks — has the effect of dampening mark-to-market volatility, contributing to smoother return profiles and smaller drawdowns relative to benchmark notional duration.

Third, the spread cushion over US Treasuries provides a buffer against rate volatility that pure duration instruments lack. The net effect is an index return stream characterised by relatively low annualised volatility compared to its yield level, a dynamic that elevates the Sharpe ratio relative to lower-yielding, higher-duration developed market benchmarks.

For institutional investors managing against risk budgets or volatility constraints, this efficiency is particularly valuable as it allows meaningful fixed income exposure to be maintained with lower overall portfolio volatility. For broader retail investors, the stability of the asset class can be seen as a useful building block within a broader asset allocation framework.

Diversification benefits and correlation

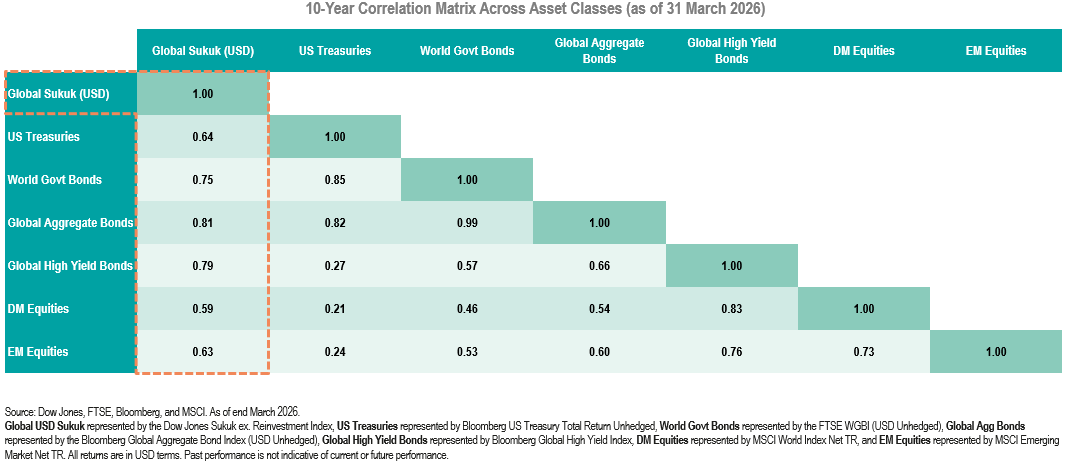
Global USD sukuk also offers genuine portfolio diversification benefits, deriving from its moderate correlation with conventional fixed income benchmarks and with global equities (see Exhibit 4).

Exhibit 4: USD Sukuk offers moderate correlation with other major public asset classes

While the asset class shares some sensitivity with broader EM credit spreads — given its hard currency, spread-product nature — its return drivers are sufficiently distinct to reduce co-movement with developed market rate instruments. The moderate correlation also extends to DM-heavy fixed income asset classes like US Treasuries, World Government Bonds and Global Aggregate, and the correlation numbers are further reduced when compared to public equity assets.

This diversification profile means that adding global USD sukuk to a multi-asset or fixed income portfolio can reduce overall portfolio volatility while maintaining or enhancing expected return — the hallmark of a genuinely accretive allocation rather than a purely substitute one.

Conclusion

Global USD sukuk has firmly established itself as a distinctive and attractive allocation within the fixed income universe. With global sukuk issuance reaching record levels in 2025 and foreign currency-denominated issuance exceeding $100 billion — nearly double the volume of just four years prior — the asset class continues to deepen in breadth, liquidity and issuer diversity.

For investors, the proposition is multifaceted: 

  • An investment-grade universe anchored by fiscally sound sovereign and quasi-sovereign borrowers
  • A decade-long track record of superior cumulative returns versus major conventional fixed income benchmarks
  • A compelling Sharpe ratio reflecting efficient risk-adjusted performance
  • Diversification characteristics that complement both equity-heavy and bond-dominated portfolios. 

Sukuk now accounts for a sizeable portion of all emerging market dollar debt issuance, and has gained a market share that reflects growing mainstream institutional acceptance rather than niche demand.

As the global fixed income landscape continues to grapple with fiscal pressures in major developed economies, elevated duration risk, and the search for yield without excessive credit risk, global USD sukuk offers a compelling answer that combines the income characteristics of EM debt with the credit quality discipline and structural resilience of an asset class that has never recorded a default within its investment-grade benchmark constituency.

For investors yet to allocate, the case is increasingly difficult to ignore.​​​​​​​​​​​​​​​​

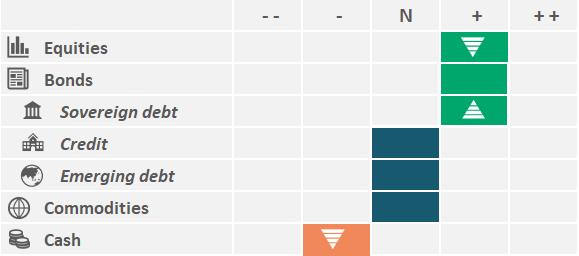
  • Overweight global equities – We remain positive on global equities, albeit more modestly, and have trimmed some US exposure. The earnings season has been very strong for both tech and financial firms, but also more broadly. Our more modest allocation reflects early signs of stress at the weakest end of the US high yield market and increasingly hawkish communications from the US Federal Reserve
  • Focusing on attractive sectors in wake of the momentum unwind – After a frantic rotation within equities, our overlay risk is now focused on the US technology sector (Nasdaq) which has suffered from a period of relative weakness. We also find US and Eurozone banks attractive
  • Neutral Eurozone duration, buying two-year US Treasuries – For now, we remain neutral on duration in the Eurozone. Following lower inflation data, and despite recent hawkish comments by Fed policymakers, we have added duration in the short end of the US curve 

By Andrew Etherington, Head of Multi-Asset Total Return, AXA IM Core, part of BNP Paribas AM

The re-escalation of Middle East hostilities has effectively buried the Memorandum of Understanding between the US and Iran.

While markets enjoyed a strong rally following April’s recovery, broad equity indices have been struggling to advance since the beginning of June.

Investors’ positioning is elevated overall, with systematic strategies more heavily exposed, whilst discretionary investors are close to neutral and have therefore potential to increase holdings.

Global risk appetite is having to contend with a second-quarter earnings season that has started impressively on the one hand, and rising oil prices on the other, pushing central banks to be increasingly hawkish and driving real yields up.

Broadly positive on shares

We remain positive on equities but have marginally reduced our allocation. The background has even improved lately – macroeconomic surprises in the Eurozone turning net positive, a so far stellar reporting season, and a positive bias to analysts’ revisions.

Nonetheless, our proprietary quantitative signal for US equities has fallen sharply, brought down by monetary policy uncertainty and some early signs of credit risk, the latter albeit focused on the weakest part of the market.

Therefore, our qualitative expectations have been effectively tempered by our quantitative inputs, and we have chosen to take profits on a portion of the equity allocation.

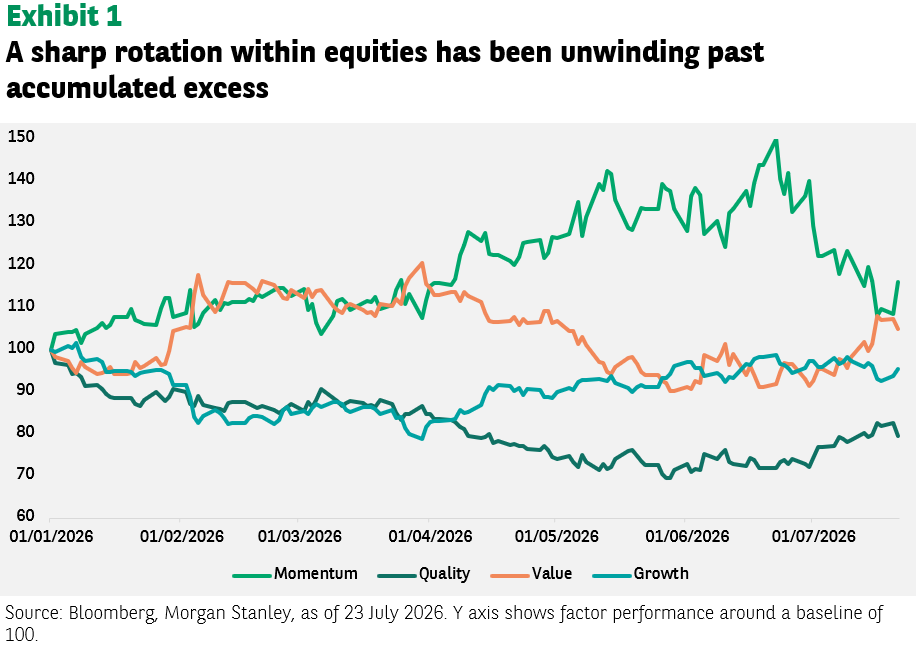
Furthermore, equity markets experienced asecond rough rotation in as many months, with momentum giving back a significant portion of its outperformance from the previous quarter (see Exhibit 1).

Concomitantly, single-stock volatility has increased exponentially, and while broad index volatility (e.g. the VIX index) remains contained, such moves do not necessarily suggest a more severe bout of risk aversion.

Similarly, the recent weakness in CCC credit seems more idiosyncratic and sector-specific and is likely to potentially offer better returns in the quarter ahead rather than expand across the broad equity market. We held our positions in US technology after the shake-out which, combined with earnings upside, has cheapened valuations.

We have also maintained our relative preference for US financials and Eurozone banks where investors’ positioning is low and rising. We would expect equity markets to resist a hike or two, as currently priced by markets, while the macro and the microeconomic backdrop remain strong.

A series of interest rate hikes would however likely prove painful, especially with the equity risk premium already at relatively unattractive levels.

Fixed income: Wait and see

On the fixed income side, we are biding our time before taking advantage of higher yields in the Eurozone, as we are fundamentally sceptical that the European Central Bank will be able, or even willing, to raise policy rates more than twice this year.

In the short run, we are more confident that we are approaching peak hawkishness from the US Federal Reserve and its new Chair Kevin Warsh. The Fed’s tone is certainly at its most aggressive since the pandemic following a series of (favourable) misses on inflation data compared to market expectations.

Following softer US inflation data for several months, including an outright decline in June, we chose to add US duration at the short end of the yield curve.

The most recent rise has been led by real yields rather than higher break-even inflation, hence any relief there would also be welcome for equity markets.

Elsewhere, Japan 10-year yields have lost some of their upward momentum lately as suggestions circle over creating tax breaks for local investors in Japanese government bonds, as well as diverting investment flows from the Government Pension Investment Fund to the domestic bond market.

Neither appear to be ultimately realistic and the friction between the Bank of Japan’s needs to raise policy rates and the government’s preference for a weak yen is set to persist.      

In recent months, credit markets concerns have been largely anecdotal and focused on ‘what if’ scenarios for private credit redemptions.

These have often ignored the large inflows from investors, or impending stress from significant and price-insensitive issuance from new entrants to the credit markets that might challenge what are historically tight levels for spreads.

While some truth resides in both cases, evidence of stress was thin on the ground. We are focusing on any signs of contagion from the widening of spreads in CCC markets up the credit quality spectrum, to Bs and BBs.

The bifurcation of CCCs versus Bs and BBs is unusual and worrisome if it were to persist.

  • Insurers manage their asset portfolios in a multidimensional and complex environment, combining multiple objectives and constraints. Recent history shows that all parameters are interdependent and evolving, including sudden and non-linear macro shocks
  • Beyond current circumstances, insurers should contemplate how they can strengthen their investment and risk management frameworks – and consider exploiting a broader set of asset classes and investment management techniques
  • Enhancing investment and risk management frameworks is not straightforward and requires reinforced resources, skills, tools and processes. Insurers may have to make strategic decisions to determine the optimal level of outsourcing, from building blocks to more holistic solutions

By Arnaud Lebreton, Head of Client Relationship Management

We live in a complex, uncertain and fast-changing world, where organisations need to adapt to thrive – and this is especially true for insurance companies, whatever their market or business line. Insurers manage balance sheets and asset portfolios in complex, and multidimensional, local and global frameworks. They must build and manage a portfolio which matches their liabilities while protecting and stabilising their economic and regulatory capital position.

In addition, insurers need to navigate macroeconomics, alongside financial markets, and maximise policyholder and shareholder investment returns in a risk-controlled manner.

They must steer their financial results and contain profit and loss volatility under different accounting standards and factor in sustainability, climate risk and impact on society.

These are all dimensions which need to be taken on board by insurers, and the equation is becoming ever more complex as these parameters are interdependent and evolving over time.

READ THE FULL PAPER

The world of finance in two minutes

The European Central Bank left its benchmark interest rate on hold at 2.25%, as expected, citing that uncertainty remains high. The central bank, which lifted rates by a quarter point in June, also noted that while eurozone inflation declined last month to 2.8%, from May’s 3.2%, the effects of the Middle East conflict are likely to keep inflation above the 2% target into the first half of 2027. While the decision to keep rates steady was unanimous, ECB President, Christine Lagarde said “there were some governors who asked themselves whether we should not consider a hike”.

Around the world

The oil price surpassed the $100-a-barrel mark, for the first time since May on Thursday, following further hostilities in the Middle East. Oil prices have been rising in the wake of the breakdown of the ceasefire between the US and Iran, and the global benchmark, Brent crude, broke through the threshold after attacks in the Red Sea. Lower oil prices had provided some respite during June, which saw inflation drop in several major markets. In addition, late last week, the US government renewed its trade war as it introduced a new wave of tariffs on dozens of nations.

Figure in focus: 60 trillion yuan

China aims to increase retail sales to around 60 trillion yuan (around US$8.8 trillion) by 2030, as part of a five-year plan to boost domestic consumption. This would represent an almost 20% increase on 2025’s figure, according to reports. China has suffered from weak domestic demand, which contributed to its slowest quarterly pace of economic growth since 2022 in the second quarter of this year, recent data showed. This is the first time Beijing has launched a five-year plan specifically prioritising consumption, while also aiming to boost employment and raise household income to support the domestic economy.

Chart of the week

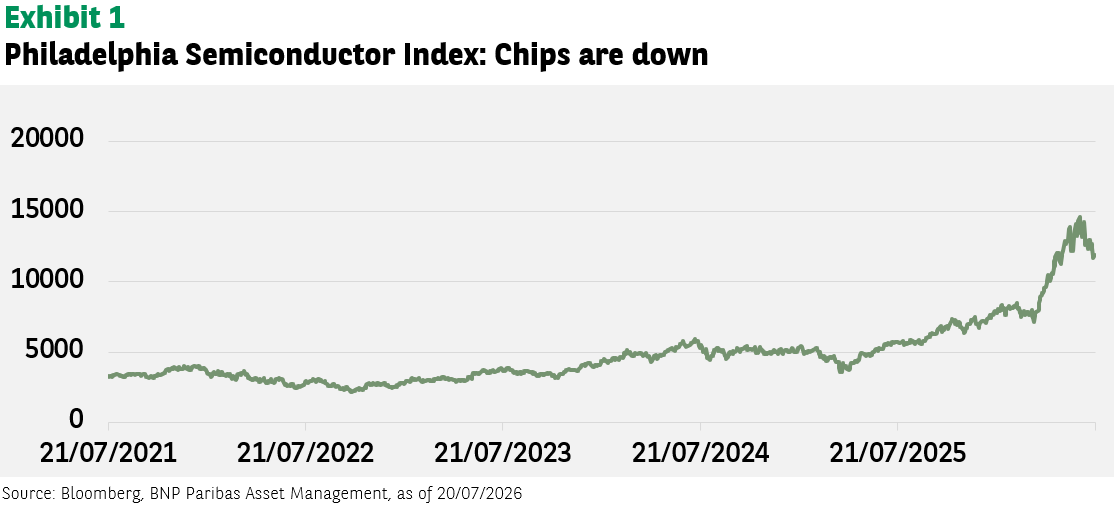
An 80% plus rise in the first six months of 2026 put the Philadelphia Semiconductor Index (SOX), which tracks the biggest US-listed chip manufacturers, on track for its largest annual return since 1999. But over the past month, it has fallen by around 20%. Prices for the chips that underpin artificial intelligence have surged this year as suppliers struggle to match soaring demand from large technology companies. The rapid rise reflects the continuing demand for AI and its necessary components, though the recent sell-off showed how some investors are questioning how long the demand boom can continue.

Words of wisdom: ESPR

Large European companies are no longer allowed to destroy unsold clothes, accessories or footwear, as part of new measures to support the transition to a circular economy. Part of the Ecodesign for Sustainable Products Regulation (ESPR), which was introduced in 2024, the new rule came into force this month. It means large companies must now prioritise selling, donating or repairing items, with medium-sized companies subject to the same ban from 2030. Currently, 4%-to-9% of all textile products on the market in Europe are destroyed before use, the European Commission said.

What’s coming up?

Monetary policy is in focus this week. On Wednesday, the Federal Reserve convenes to set interest rates, while the Bank of England meets on Thursday, followed by the Bank of Japan on Friday. In terms of economic data, the Eurozone and US issue their respective preliminary estimates for second quarter GDP growth on Thursday. On Friday, the eurozone publishes flash inflation data for July.

The primary beneficiary of the artificial intelligence capital expenditure boom has been emerging market technology hardware and semiconductor stocks, particularly in Korea.

At their peak this year, an index of these stocks had advanced nearly 120% since the beginning of 2026 (for Korea it was over 250%). The recent 15.6% drop has reduced the year-to-date return to ‘just’ 85%.

By Daniel Morris, Chief Market Strategist

Listen to the article

There has been comparatively little contagion to other markets. US hardware and semiconductor stocks have fallen 5.8% over the last few weeks but are still up 36% year to date.

US software stocks have weakened a bit, but globally, non-tech stocks have seen modest gains, despite rising interest rates and renewed conflict in the Middle East (see Exhibit 1).

What goes up must come down?

The dramatic drop in EM tech stocks has understandably raised questions about whether the AI bubble is bursting. We are of the view that the sell-off is more technical than fundamentally driven. Given the large increase both in stock prices and in earnings for the sector, above-average volatility was to be expected.

Foreign investors have been selling Korean equities since February, according to data from the Korean Stock Exchange, likely prompted by a desire to rebalance portfolios and take profits. The redemptions accelerated in May and June, contributing to the depreciation of the won over the period. 

Individual Korean investors, however, have been willing buyers of the shares being sold. US-domiciled ETFs, meanwhile, have had inflows all year (except for May) and July’s flows are already higher than they have been for any month this year.

One factor that has been suspected of contributing to the depth of the market’s decline has been the popularity of leveraged ETFs.

Providing the opportunity to investors to double their gains (or losses) in a market that has already doubled in value can understandably be seen as a sign of excessive (if not necessarily irrational) exuberance.

While the funds have proved popular, with assets under management reaching $33 billion at their peak, it is not obvious that they were behind the swing in investor sentiment.

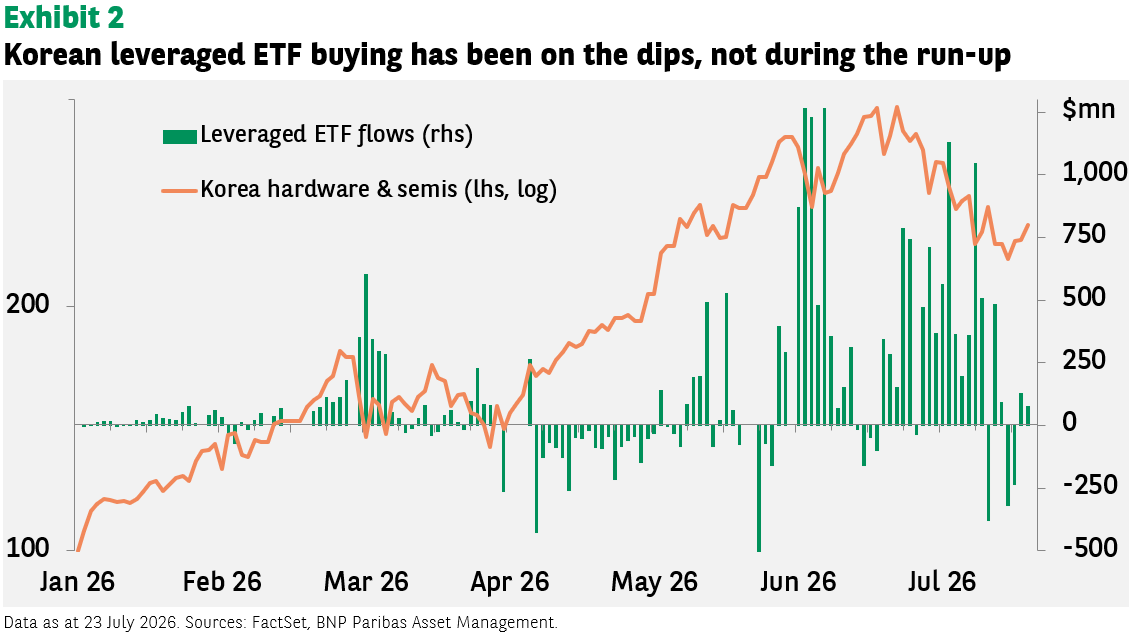
During the big run-up in the stocks, which began at the end of March, flows were negative. The inflows have primarily come during market sell offs, like the one in March after the start of the Iran war, and the two in June (see Exhibit 2).

The continued decline in the market in July shows that fund flows do not determine market direction, but they do suggest many investors still see prospects of a recovery in share prices.

The primary risk to the market would be any indication that capex was fading. In fact, the opposite seems to be the case. The recent decline in Alphabet’s price following its earnings release was partly due to the company’s plans to increase capex spending despite the company’s results beating expectations.

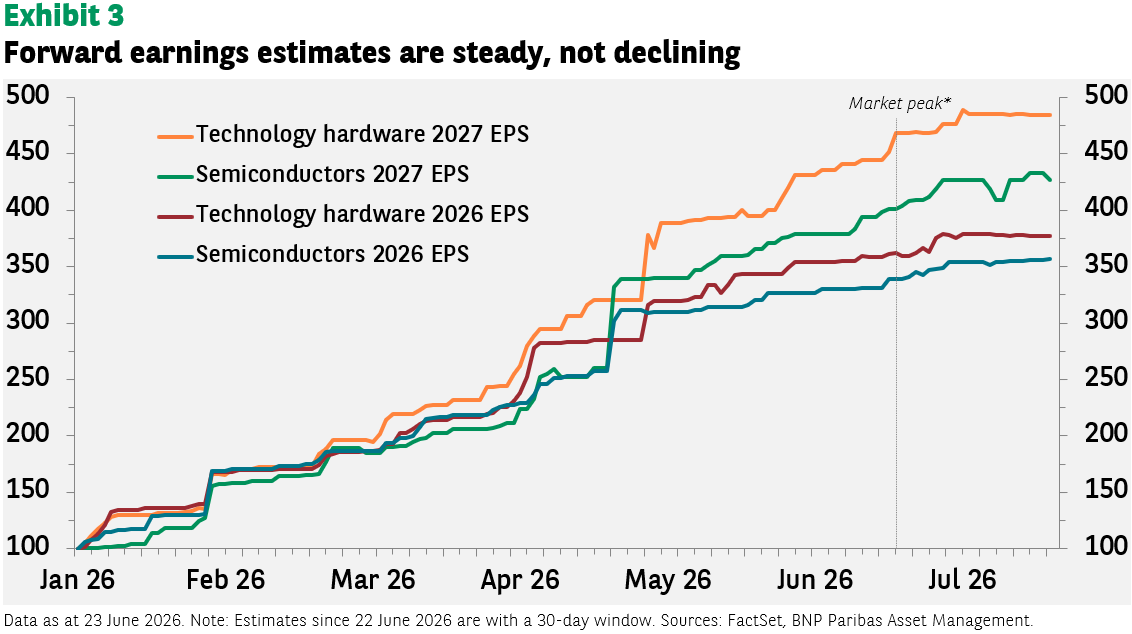
Moreover, one does not see a downturn in analyst profit expectations. Since the market’s peak in late June, earnings expectations have been steady (including only those estimates changed or verified over the last 30-days – see Exhibit 3).

Given announcements for increased capex spending from the hyperscalers, we would expect estimates for 2027 to move up again. The impact on 2026 forecasts may be less due to production constraints.

Another potential catalyst for the sell-off is valuations, though high valuations by themselves rarely provoke a market correction in the absence of another factor.

At late-June’s market peak, the MSCI Emerging Markets Technology Hardware & Equipment index’s forward price-earnings ratio was 11.3 times compared to a long-run average of 13.9, that is, P/Es were below average even then and are even lower now.

For the semiconductor index, P/Es were above average (15.8 times vs. 13.6), but today they are 14.2, giving a z-score (standard deviation from the mean) of just 0.3. Given the growth prospects for the sector, that does not seem ‘excessive’, let alone irrational.

Data sources: FactSet, BNP Paribas Asset Management as of 24 July 2026 (unless otherwise stated). Past performance should not be seen as a guide to future returns.

Equities in the US, Europe, Japan and emerging markets should see strong second quarter earnings growth. As Nadia Grant, Head of Global Equities, tells Chief Market Strategist, Daniel Morris, year-to-date equity returns have been highly concentrated, notably AI-linked hardware stocks ‘at the expense of everything else, particularly software’.

Nadia expects a broadening of returns to other sectors in the second half of the year, including defence, which has underperformed and is becoming more attractive from a valuation standpoint alongside good growth prospects. “We also like resource independence with exposure to metals like copper or aluminium that, although hard hit by the Iran conflict, are economically sensitive and seeing supply constraints.”

You can also listen and subscribe to Talking Heads on YouTubeSpotify, or wherever you normally get your podcasts.

XXX BNP AM

Read the transcript

Talking Heads with Nadia Grant

Daniel Morris: Hello, and welcome to the BNP Paribas Asset Management Talking Heads podcast. Every week, Talking Heads will bring you in-depth insights and analysis on the topics that really matter to investors. In this episode, we’ll be discussing global equities. I’m Daniel Morris, chief Market Strategist, and I’m joined today by Nadia Grant, Head of Global Equities. Welcome, Nadia, and thanks for joining me.

Nadia Grant: Thank you, Daniel, I’m very pleased to be here.

DM:  We’re at the midpoint in the year, Nadia, and I think it’s safe to say most equity investors are pleasantly surprised with the returns that we’ve had. No lack of things that could have gone wrong. Always worried about the lingering effects from tariffs, there’s the situation in the Middle East, but through all of this, equities [are] just powering along. That said, there’s always volatility, and we’ll talk particularly about what’s been going on in emerging market tech stocks. But could you start us out [with] how you see the return dynamics so far this year? Any highlights you want to bring out?

NG: The word I would use to describe year-to-date returns is ‘concentration’. In January, we could see some tentative signs of broadening in market performance. Geopolitical uncertainty, with the closure of the Strait of Hormuz, really accelerated the outperformance of AI (artificial intelligence) at the expense of everything else, particularly software. With high quality, high ROE (return on equity) asset-light companies really penalise[d], and the picks and shovels of AI outperforming, the share of the S&P constituent outperforming the index so far this year is really low compared to [the] historical norm, about 40%.

What’s more, the market has been driven by positive earnings revision[s] versus multiple expansion, so that has actually led to a derating of the S&P 500 year to date. From a sector viewpoint, the positive revisions have been driven by the technology and energy sector[s], and conversely, healthcare has seen negative revision followed by [consumer] staples.

At a market cap level, when we look at the Russell 2000, in contrast, that has seen negative earnings revision[s], and we’re seeing a similar picture looking at the MSCI ACWI, the all country world index, seeing positive earnings revision of about 9% year to date, driven by [the energy, tech [and] material sectors, while consumer discretionary, healthcare and real estate sectors have seen their earnings revised downwards this year.

DM: We’re at the beginning of the US earning season. The banks have reported so far with very strong results. Always, earnings are what drive equity markets. I think we know the absolute results we get this quarter are going to be likely pretty good, but that may not be enough given how high expectations are. What do you anticipate for the rest of the season?

NG: As you said, about 10% of companies by market cap should have reported by today, Friday, led by the financials, and we will expect the ‘magnificent seven’ earnings [results] to begin [to come out] towards the end of July.

For the second quarter of 2026, we’re expecting S&P earnings to grow 22% which is well above long-term historical averages, and that’s driven by a strong contribution from energy, where earnings are set to more than double for this quarter. Technology, where consensus is expecting earning[s] to grow about 60%, and materials about 30%.

On the flip side, healthcare is expected to see negative earnings growth for this quarter versus last year of about 19%; real estate -2% and consumer, excluding Amazon, +3%, which are for the three laggers well below [the] historical norm.

Consensus also expect[s] tech, energy and materials to lead from a margin expansion standpoint year-over-year, and thus we are expecting [the average] S&P profit margin to grow from 13.5% to just under 15%, while industrial healthcare and discretionary are expected to see their margin contracts. Similar picture on small cap[s], where margin[s] are expected to contract a bit.

When we look at Europe, [a] really strong picture there as well, with earnings expectations for growth of about 12%. And I would note there that EPS (earnings per share) revisions have been improving from negative earlier in the year to an inflection and improving – an improvement that has coincided with positive manufacturing data like the PMI (Purchasing Managers’ Index) in Q2.

Japan, too, is on pace for about 12% earnings growth this quarter, and EM (emerging markets) is the stand-out, with earnings expected to grow over 60% this quarter, driven by tech. I would note as well that negative pre-announcements are well below [the] typical level this quarter, and that is likely symptomatic of a better economic, and therefore fundamental, backdrop globally.

So, to answer your question, Daniel, I still believe there is scope for earnings to be delivered despite the high bar this quarter.

DM: You mentioned the high results we anticipate for emerging markets, again driven primarily by the [tech] hardware sector, and that’s important to keep in mind when we look at the returns that you’ve had for that sector year to date. The point being that the gains in the indices and the stock prices [are] largely driven by earnings growth as opposed to an increase in valuations.

That said, there’s been a bit of a sell-off over the last few weeks. If you just take the [tech] hardware stocks in emerging markets, they’re now down 16% at the time we’re recording from the peak. That said, it still leaves those stocks up 84% year to date, so not shabby situation. What’s your take on what’s happening? Is it an indication that the AI boom is starting to bust?

NG: We’re expecting over 60% earnings growth in EM in the second quarter, which, unsurprisingly, is driven by semis [semiconductor companies] in hardware. The concentration in market performance that we mentioned in the developed market has also been seen in EM and – as you mentioned – fundamentally driven because it’s all about earnings, and that pace of earnings growth has actually surpassed that of the price action.

When you look at [South] Korea, really the best evidence of that – that’s the proxy for memory and hard bandwidth memory – that really is a bottleneck within the AI supply chain. [The] Korea[n] market had doubled when we look at the picture at the end of June, while consensus

for the full year [20]26 is for earnings in the country to almost quadruple. Same picture in Taiwan, but with a lesser magnitude.

So, I would note that the pace of growth is set to decelerate from H1 to H2, and this is why we lean towards a broadening of sector performance. That’s something that we [have] started to see, as you mentioned, particularly in the US, we saw the equal weight index starting to outperform the cap weighted index.

However, when we talk about conviction, we don’t think this is indicative of a bust. We’re still very early on, and as indicated in the AI build out, valuations are not demanding as earnings have outpaced those price action[s].

DM: You mentioned you’re expecting a broadening of the returns across sectors in the markets. If you look ahead, what other parts of the market, sector[s], countries do you find the most attractive?

NG:  In addition to the semi[conductor]s and hardware that we like, given this historic AI infrastructure build, and post the correction that you mentioned we’ve had since the beginning of June, we continue to like that space. But when we look at sector contribution to earnings in the US, almost all of the sector[s] [have] contribute[d] to S&P earnings this year, and that is a stark contrast to what we witnessed the prior years.

That’s why we balanced our AI conviction with other secular themes like defence that has underperformed and is becoming increasingly attractive from a valuation standpoint, particularly given the growth prospects. We like resource independence with exposure to metals like copper or aluminium that have been hard hit by the conflict in Iran and yet [are] economically sensitive and [seeing] supply constraint[s].

We also lean towards that recovering PMI that we’ve seen in the US, and [we] like sectors like transport, where the administration crackdown on immigration and the installation of a language test for truck driver[s] has led to a tightening of supply and therefore higher truck weights at a time when [the] demand outlook is improving.

DM: If I could summarise some of the key points you shared with us, Nadia, if we think about how the market has performed year to date, the word you highlighted was ‘concentration’ – everything very much centred around the performance of AI.

That said, you’re looking for some broadening in the returns to other sectors in the year ahead. You think performance should be supported by strong earnings growth for the upcoming second quarter earnings season in the US, looking for 22% growth in the S&P [index]. And finally, other sectors beyond AI that you find attractive included defence and resource independence. Well, Nadia, thank you very much for joining me.

NG: Thank you.

DM: That’s it for this week’s episode of Talking Heads. If you would like more information about our capabilities in global equities, please reach out to your asset management contact or check out Viewpoint, our website for investment insights at viewpoint.bnpparibas-am.com.

We recommend subscribing to Talking Heads on your favourite podcast channel, such as YouTube or Spotify. You’ll receive your podcast episodes every week. If you like Talking Heads, leave us a positive review and a nice rating.

You’ve been listening to the BNP Paribas Asset Management Talking Heads podcast with me, Daniel Morris and Nadia Grant, Head of Global Equities.

Please do join me next week. Until then, take care.