
The US equity market posted exceptional returns over the decade that ended in 2024. However, a large proportion of the performance came from multiple expansion. From an historical perspective, this was unusual. Any expectations that the next decade might see a repeat should, in our view, be treated with caution, writes Carmine De Franco, Head of Quant Equity Management.
The exceptionalism of the US equity market has been one of the defining characteristics of the last decade. The 10-year total return of the S&P 500 to December 2024 was around 240% in US dollar terms. Over the same period, we saw the following returns for other indices:
- The MSCI EMU index returned 110%
- The UK FTSE 100 returned 82%
- Japan’s TOPIX index returned 148%
- The MSCI China index was last, returning 44% (all figures in local currency).
We can pinpoint many factors to explain the exceptional performance of US equities compared to the rest of the world: from the dynamism of the economy to the dominance of US companies in the most promising technologies. But how exceptional was the 2014-2024 performance from a multi-decade perspective?
Remarkable, but not unprecedented
Using data going back 1871, Exhibit 1 shows the 10-year total return for each decade starting in 1884 and ending in December 2024. We also show the long-term average and a 2-standard deviation interval. Finally, we show on a log scale the compounded nominal value of $1 invested in the S&P 5001 in December 1884.
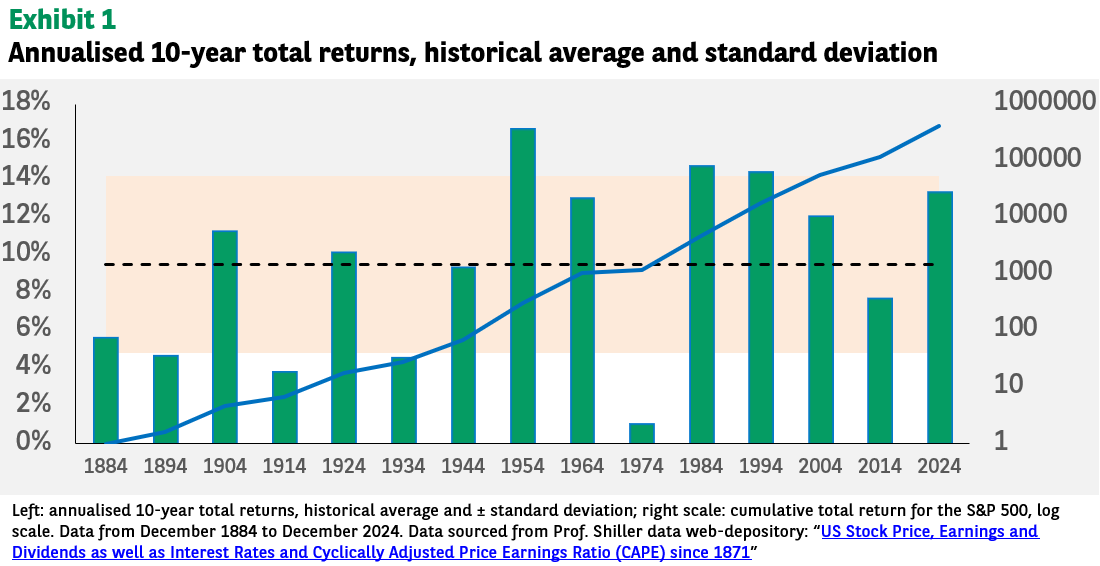
The S&P 500’s returns have varied, but over each 10-year period, the nominal total return has always been positive. The last decade saw strong returns, with an annualised performance of 13.3%, well above the long-term average at 9.5%, yet still just within the 2-standard deviation interval.
Apart from the decade ending in 2014, which included the Global Financial Crisis (GFC), and the 10 years through 1974, performance of the 2014-2024 decade was much in line with the level of 10-year performance since the end of World War II. From an historical perspective, therefore, the US market’s performance in the last decade was remarkable, but clearly not unprecedented in magnitude.
‘Business’ and ‘market’ components of total return
To get a better understanding of the long-term performance drivers of the US market, let us decompose the total return as the combination of a ‘business’ and a ‘market’ component:


More precisely, it captures the component of the market return that can be attributed to the joint effect of growing earnings and valuations.
We combine the dividend yield and the earnings growth terms as the ‘business’ component, with the idea that they are mainly derived from the economic results of individual US companies.
Separately, the P/E growth and the repricing terms are labelled together as the ‘market’ component since their values depend directly on market prices, so they reflect market participants’ expectations.
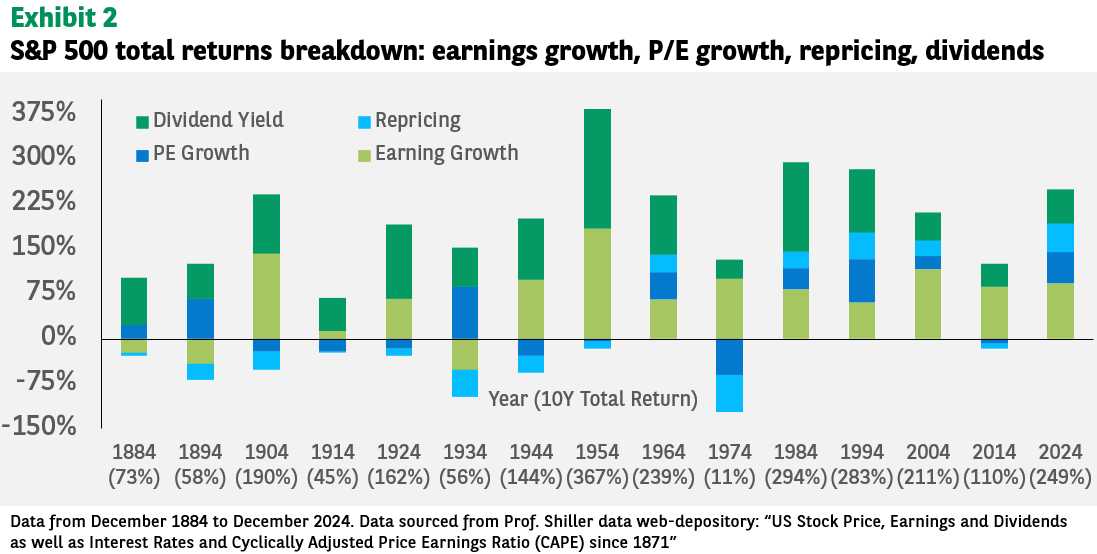
Exhibit 2 provides an historical perspective of the S&P 500 total return’s four components by decade (we show the total return on the x-axis for ease of reading).
We can see that
- The earnings growth component has been positive almost always since 1884, with few exceptions. Furthermore, it has always been positive since 1944
- The dividend component, positive by definition, has varied quite widely over time, and has generally decreased in the last few decades
- The P/E growth component has also been volatile, and negative more frequently than earnings growth.
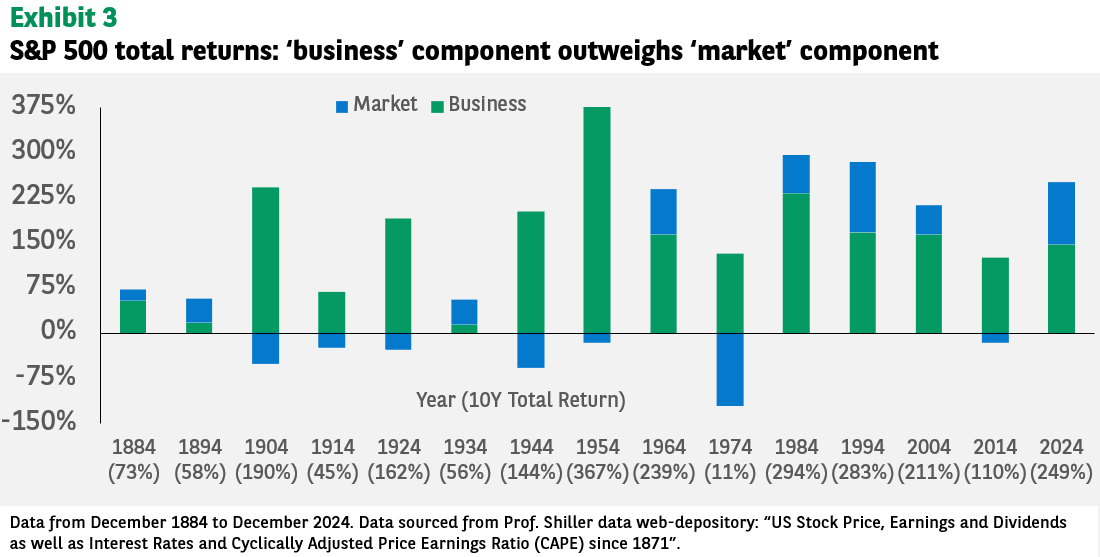
The same analysis using the aggregated ‘business’ and ‘market’ components, shown in Exhibit 3, offers a compelling illustration of the drivers of US market performance over time.
So, what drives the total return?
By using the broad ‘business’ and ‘market’ categories, we see that in the long run, the business component drives the total return. The market component was positive by only a relatively small amount over the two last decades of the 19th century and negative for the first half of the 20th century, except for the decade ending in 1934.
The most recent decade stands out: the market component accounted for a substantial proportion of the total return. Its contribution was the second highest since 1884. Only the decade ending in 1994 saw a superior contribution from the market component.
Looking at both Exhibit 1 and Exhibit 3, we can conclude that the decade ending in 2024, while solid, was not particularly atypical from a total return perspective. However, it was unique in the sense that a large element of that total return came from the market component: multiple expansions and repricing. At least from an historical perspective, this was indeed out of the ordinary.
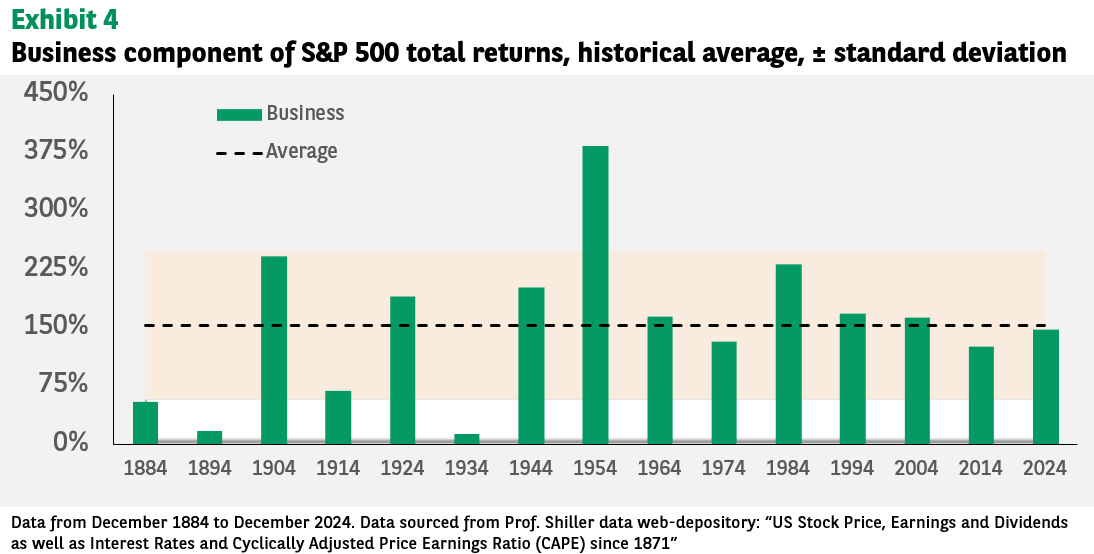
More precisely, when we look at both the ‘business’ and ‘market’ components from an historical perspective, we see that the last decade has been, to a certain extent, anomalous. Exhibit 4 extracts the business component from Exhibit 3, while adding the long-term average and a 2-standard deviation interval.
Close to the long-term average: earnings growth and dividends
Since the end of World War II, the business component’s contribution to the S&P 500’s total return has been well within the 2-standard deviation interval, if we exclude the immediate after-war decade where earnings growth was abnormally high, driven by, for example, the Marshall plan, the GI Bill, rising consumerism and growth of the American middle class.
Since then, however, the business component has been relatively stable and close to the long-term average. The last decade was no exception: earnings growth and dividend yields totalled 148%, whereas the long-term average is about 153%. We believe it is fair to say that from an historical perspective, the last decade does not carry any sign of exceptionalism.
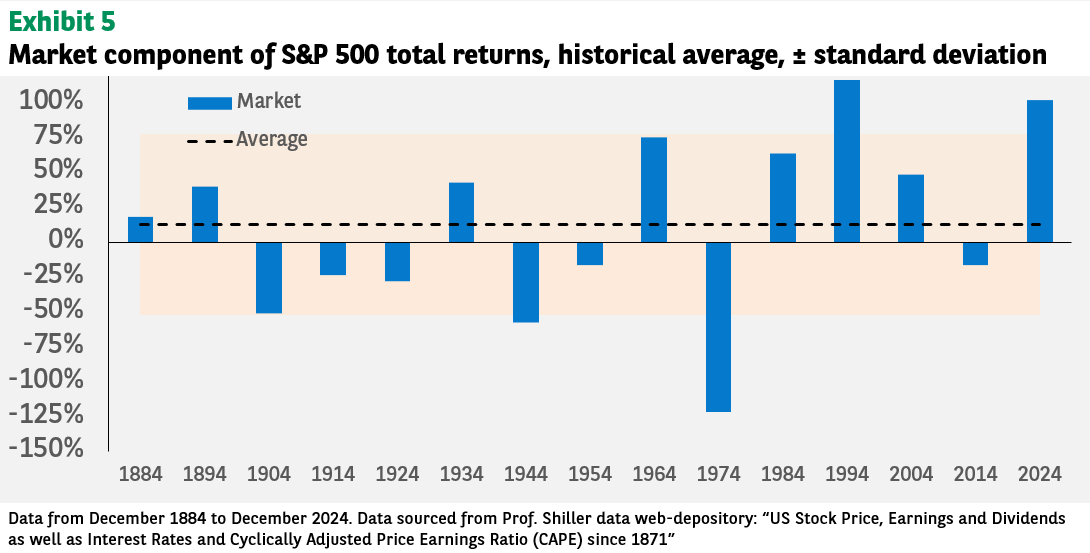
The same exercise for the market component tells a different story, as shown in Exhibit 5.
A more normal P/E growth component looks likely
First, we notice that the long-term average of the market component is significantly lower than the business component average: 153% for the business component against 13% for the market component – more the 10 times higher. Clearly, over the long run, the total return of the S&P 500 has been driven by the business component: earnings growth and the dividend yield.
Second, the last decade’s market component was significantly above the 2-standard deviation interval. As stated previously, only the 1984-1994 had seen a market component as high as the last decade’s. What is even more impressive is the gap between the last value (101%) and the long-term average (13%) – almost a 10-fold difference.
Finally, the market component has been much more variable than the business one. Although it is not impossible that the next decade might surprise to the upside, we believe that, from an historical perspective, the last decade has been quite exceptional and a return to normality must be considered as a reasonable possibility.
Business and market components: 10 years ahead
There has been a lot of research on the causes of exceptionalism in the US market, from the secular downward trend in interest rates to the rise of giant tech companies; from the concentration and pricing power that just a few mega companies command in the US economy to the rise of passive investing.
It is likely difficult to distinguish the effects of each probable cause, even if all seem plausible. But from a practical perspective, for investors with long investment horizons, it is reasonable to expect that 10 years from now, in 2034, the total business component (earnings growth and dividends) will be at around the long-term average.
However, when it comes to the market component – if history is any guide – the number we will see in 2034 is anyone’s guess. What does seem sure is that anticipating another strong decade of price-to-earnings growth and positive repricing would be highly risky.
[1] The market index is proxied with a composite basket before the S&P 500 index was officially created. Here, we used ‘S&P 500’ as the combination of the official index and its proxy since 1871


